2/07/17 ELO Ratings Update

Yikes, has it already been 5 weeks?  Sorry for the second long hiatus, but here are the updated ratings for the home stretch of the playoff push, along with 10000 simulations of the rest of the regular season and playoffs:

Rank Team ELO Rating ELO Change Rank Change Average Points Stanley Cup Strength of Schedule President Cup Division Winner Playoffs Δplayoff Percentage
1 WAS 1606 41 1 117 22% 0.2 56% 68% 100% 5%
2 PIT 1585 2 -1 113 13% -4.1 18% 24% 100% 0%
3 MIN 1569 15 0 113 12% -1.1 19% 90% 100% 1%
4 SJ 1555 5 1 106 10% -6.2 1% 75% 100% 2%
5 NYR 1549 -3 -1 103 7% 1.9 1% 1% 98% 3%
6 ANA 1538 3 2 100 6% -9.8 0% 20% 99% 8%
7 CHI 1537 -7 -1 102 5% -3.3 0% 10% 100% 1%
8 CLB 1532 -9 -1 108 4% 7.2 5% 7% 100% 1%
9 NAS 1522 9 4 93 3% 4.2 0% 0% 82% 20%
10 MON 1515 -5 1 101 4% -1.0 0% 68% 97% 5%
11 NYI 1512 17 7 91 1% -0.8 0% 0% 42% 25%
12 STL 1512 -18 -3 91 2% -1.5 0% 0% 76% -14%
13 LA 1509 -4 -1 92 2% -4.8 0% 1% 83% 6%
14 OTT 1503 6 3 96 2% -3.6 0% 24% 83% 14%
15 TB 1503 -26 -5 85 0% -1.2 0% 0% 14% -49%
16 DAL 1501 -10 -2 84 1% 1.4 0% 0% 22% -33%
17 BOS 1500 -3 -2 89 1% -0.8 0% 1% 34% -12%
18 FLO 1488 -3 1 88 0% 1.4 0% 1% 27% 4%
19 PHI 1480 -20 -3 88 0% 6.1 0% 0% 16% -32%
20 CAR 1475 0 1 88 0% 1.8 0% 0% 20% 0%
21 WPG 1475 1 1 82 0% 3.4 0% 0% 13% -10%
22 EDM 1471 14 2 95 1% -3.0 0% 4% 92% 40%
23 TOR 1470 14 2 90 1% 2.2 0% 4% 47% 31%
24 CGY 1468 -8 -4 85 0% -2.8 0% 0% 28% -20%
25 DET 1467 3 -2 84 0% 3.7 0% 0% 8% 2%
26 NJ 1462 11 0 85 0% 4.4 0% 0% 7% 4%
27 BUF 1450 6 0 82 0% 0.7 0% 0% 6% -1%
28 VAN 1438 2 0 80 0% 2.6 0% 0% 6% 1%
29 COL 1404 -28 0 59 0% 3.3 0% 0% 0% -1%
30 ARI 1403 -9 0 67 0% -0.7 0% 0% 0% 0%

All in all, not a lot of drastic change in the rankings for the long hiatus.  The Islanders are starting to look much stronger, while St. Louis and Tampa are starting to fade away.

The big news today (especially here in the northeast) is the firing of Claude Julien by the Boston Bruins.   Now certainly the Bruins have kind of disappointed and failed to live up to expectations recently.  They finished with the 13th best ELO last season, but failed to make the playoffs.  In the 2014-2015 season, the Bruins actually finished as the 5th best team in ELO, but also missed the playoffs.

This year, they have been pretty much the definition of mediocre, but they haven’t really been failing to meet expectations like the last couple of years.  Below are ELO has expected them to do in the season so far based on win probabilities, and their actual record:

GP Points Wins Losses OT Losses
Expected 55 62.4 28.0 20.6 6.3
Actual 55 58 26 23 6

Of course, while they haven’t been doing much worse than expected, that 4.4 points would have them in second place in the Atlantic Division right now.

Last year I looked at how changing coaches changed team’s outcomes down the stretch (Minnesota ended up +5 after Mike Yeo’s firing), and found that the major change is a drastic increase in variability:  teams either became great after finding a new coach, or disappeared into the cellars.  If nothing else, Julien’s firing will probably shake up Boston’s place in the table.
2/07/17 ELO Ratings Update

12/29/16 ELO Ratings Update

Sorry for the long hiatus!  3 different family members ended up in the hospital 5 separate times, so things have been a little hectic.

But now I have some downtime and can finally update the ratings!  No surprise that there has been a lot of changes since the last update:  Minnesota’s win streak has landed up them into 3rd place, while Columbus’s win streak has boosted them enough to be the second most likely team to win the President’s Cup.  But Pittsburgh remains the favorite to end the season on top.  Despite these trends, it seems that more teams are frittering away their playoff chances rather than making a strong push themselves.  Only 7 teams have gained more than 10% chances of making the playoffs since the last update, but Columbus alone accounts for about a third of those gains.  On the flip side, 10 teams have lost more than 10% of their playoff chances.  Detroit looks fairly likely to miss the playoffs this year as of this point.

Anyway, here are the updated ratings and results of 10000 simulations of the rest of the season and playoffs:

Rank Team ELO Rating ELO Change Rank Change Average Points Stanley Cup Strength of Schedule President Cup Division Winner Playoffs Δplayoff Percentage
1 PIT 1583 10 0 113 15% -3.1 32% 43% 100% 4%
2 WAS 1565 -1 0 106 10% 0.9 8% 12% 95% 2%
3 MIN 1554 29 6 107 10% -0.1 12% 58% 99% 17%
4 NYR 1553 -2 -1 104 7% 1.0 5% 8% 95% 3%
5 SJ 1550 7 1 105 9% -5.9 6% 67% 98% 6%
6 CHI 1543 -9 -2 104 7% -3.1 4% 30% 98% 2%
7 CLB 1541 53 12 111 7% 4.7 28% 37% 99% 57%
8 ANA 1535 -14 -3 98 6% -9.2 1% 19% 91% -3%
9 STL 1530 -1 -1 98 5% -0.9 1% 10% 91% 10%
10 TB 1529 -13 -3 94 4% -1.5 0% 14% 63% -18%
11 MON 1519 2 0 102 4% -1.1 3% 58% 92% 3%
12 LA 1513 3 2 94 4% -4.2 0% 9% 77% 2%
13 NAS 1513 -4 -1 91 3% 2.9 0% 2% 61% -7%
14 DAL 1511 -8 -4 90 2% 0.1 0% 1% 55% -11%
15 BOS 1503 -10 -2 91 2% -1.1 0% 6% 46% -14%
16 PHI 1500 5 1 94 1% 3.7 0% 0% 49% 15%
17 OTT 1497 10 3 95 2% -2.4 0% 18% 69% 28%
18 NYI 1495 -1 -2 87 1% -0.5 0% 0% 17% -10%
19 FLO 1490 -17 -4 87 1% 1.6 0% 2% 23% -19%
20 CGY 1476 22 4 88 1% -2.9 0% 2% 48% 32%
21 CAR 1475 23 4 88 0% 1.6 0% 0% 20% 12%
22 WPG 1473 -6 -1 84 0% 4.8 0% 0% 23% -14%
23 DET 1464 -30 -5 81 0% 2.9 0% 0% 7% -36%
24 EDM 1457 8 3 89 1% -2.3 0% 3% 52% 5%
25 TOR 1456 27 5 85 0% 2.5 0% 1% 16% 9%
26 NJ 1451 -27 -4 80 0% 4.5 0% 0% 3% -33%
27 BUF 1444 -5 -1 81 0% 1.8 0% 0% 6% -5%
28 VAN 1435 2 0 77 0% 2.9 0% 0% 5% -4%
29 COL 1432 -34 -6 71 0% 2.8 0% 0% 1% -26%
30 ARI 1412 -20 -1 69 0% -0.5 0% 0% 0% -11%

Hopefully everybody will stay out of the hospital, and I’ll be able to update more regularly in the New Year!

12/29/16 ELO Ratings Update

11/11/16 ELO Ratings

Finishing up some homework on my day off, so I figured I need to update the ratings.  Here are the updated ratings, along with the results of 10000 simulations of the rest of the regular season and playoffs:

Rank Team ELO Rating ELO Change Rank Change Average Points Stanley Cup Strength of Schedule President Cup Division Winner Playoffs Δplayoff Percentage
1 PIT 1573 7 0 108 13% -3.4 23% 41% 96% 2%
2 WAS 1566 3 0 106 10% -0.3 16% 30% 93% 4%
3 NYR 1555 15 3 104 8% 0.1 11% 24% 92% 10%
4 CHI 1553 15 4 105 10% -1.8 14% 52% 96% 15%
5 ANA 1549 8 0 101 9% -8.1 6% 43% 94% 9%
6 SJ 1543 -3 -3 100 8% -5.3 5% 39% 92% 0%
7 TB 1542 4 0 100 7% -2.7 5% 28% 81% 2%
8 STL 1531 -11 -4 96 5% 1.2 2% 14% 81% -7%
9 MIN 1525 -2 0 97 4% 1.6 3% 17% 82% -1%
10 DAL 1519 -3 0 92 3% 0.7 1% 7% 65% 1%
11 MON 1518 4 0 103 4% -0.9 10% 45% 89% 6%
12 NAS 1516 11 3 93 3% 1.8 1% 8% 68% 20%
13 BOS 1513 5 0 94 3% -0.3 1% 11% 60% 8%
14 LA 1510 -1 -2 93 4% -2.8 1% 13% 75% 3%
15 FLO 1508 0 -1 90 2% -0.2 0% 5% 42% -5%
16 NYI 1496 -5 1 87 1% -1.2 0% 1% 27% -12%
17 PHI 1495 1 1 89 1% 1.7 0% 1% 33% 4%
18 DET 1494 -11 -2 91 1% 1.8 0% 5% 43% -20%
19 CLB 1487 7 2 90 1% 3.8 0% 2% 41% 10%
20 OTT 1486 0 -1 90 1% -1.4 0% 5% 42% 1%
21 WPG 1479 4 2 86 1% 4.0 0% 2% 37% 4%
22 NJ 1478 1 0 89 1% 1.3 1% 2% 36% 0%
23 COL 1467 -15 -3 83 0% 2.3 0% 1% 27% -20%
24 CGY 1454 -15 0 79 0% -0.3 0% 1% 16% -17%
25 CAR 1451 -11 0 79 0% 0.7 0% 0% 7% -10%
26 BUF 1449 4 1 81 0% 2.4 0% 1% 11% 1%
27 EDM 1449 -4 -1 87 0% -0.8 0% 4% 47% -2%
28 VAN 1433 -9 0 75 0% 3.1 0% 0% 9% -9%
29 ARI 1432 3 1 76 0% -1.0 0% 0% 11% 4%
30 TOR 1429 -1 -1 78 0% 3.8 0% 0% 6% -1%

Montreal continues its pretty steady climb up the ladder, but their collapse from last year is still keeping them from the upper echelons.  The model needs a lot more evidence that they are in form before it starts to reflect that.

Edmonton lost some ground since last time (unsurprising, given their 2-3-1 record in that time), but keeping it close to some of the best teams in the league should give some hope.

On the other end, Colorado, Calgary, Carolina, and Vancouver don’t look to have much hope for this year since they just continue to fall.

11/11/16 ELO Ratings

10/30/16 ELO Update and Rankings

Sorry, between my own graduate classes and the end of term for my own classes, I’m running a little bit behind on life right now.

I finally had some time today to run the simulations and update the ratings, so here is how things look a few games into the season.  Once again, these are the results of 10000 simulations of the rest of the current season plus playoffs:

Rank Team ELO Rating ELO Change Rank Change Average Points Stanley Cup Strength of Schedule President Cup Division Winner Playoffs Δplayoff Percentage
1 PIT 1566 -2 0 106 12% -3.5 20% 43% 93% 3%
2 WAS 1563 2 0 104 11% -0.7 14% 32% 89% 2%
3 SJ 1546 3 1 103 8% -4.5 12% 49% 92% 5%
4 STL 1542 2 3 100 8% 0.5 7% 31% 88% 6%
5 ANA 1541 -7 -2 98 7% -6.8 4% 27% 84% -5%
6 NYR 1540 9 3 100 6% -0.1 6% 16% 81% 9%
7 TB 1539 -2 -1 99 7% -2.9 6% 28% 79% -1%
8 CHI 1537 -5 -3 98 6% -1.0 5% 23% 82% -1%
9 MIN 1527 17 5 98 5% 1.8 5% 23% 83% 21%
10 DAL 1522 -12 -2 93 4% 1.1 2% 11% 65% -14%
11 MON 1514 31 8 101 4% -0.7 8% 34% 83% 43%
12 LA 1511 -11 -2 94 4% -2.1 2% 14% 72% -9%
13 BOS 1508 -6 -1 92 2% -0.3 1% 10% 52% -11%
14 FLO 1508 -6 -1 91 2% -0.7 1% 7% 47% -15%
15 NAS 1506 -11 -4 89 2% 2.8 0% 5% 48% -18%
16 DET 1505 11 1 95 3% 1.1 2% 14% 63% 16%
17 NYI 1501 -7 -2 89 2% -1.3 1% 3% 39% -16%
18 PHI 1494 -9 -2 87 1% 1.7 0% 1% 29% -20%
19 OTT 1486 -5 -1 89 1% -2.3 1% 6% 41% -7%
20 COL 1482 5 1 89 1% 2.1 1% 5% 47% 10%
21 CLB 1481 7 1 87 1% 3.7 0% 2% 32% 4%
22 NJ 1476 6 2 89 1% 1.1 0% 2% 37% 10%
23 WPG 1475 -5 -3 85 1% 4.1 0% 2% 33% -5%
24 CGY 1469 -4 -1 85 1% -0.4 0% 3% 33% -7%
25 CAR 1462 -4 0 83 0% -0.3 0% 1% 18% -8%
26 EDM 1453 27 4 88 1% -1.0 0% 6% 49% 36%
27 BUF 1445 -1 0 79 0% 2.0 0% 1% 10% -5%
28 VAN 1443 -9 -2 80 0% 2.9 0% 1% 18% -6%
29 TOR 1430 1 0 77 0% 3.6 0% 0% 7% -3%
30 ARI 1429 -12 -2 74 0% 0.2 0% 0% 7% -11%

So far the model has been fairly on point, getting 75 out of the 122 games thus far correct.  Unsurprisingly, Montreal and Edmonton are the real big climbers.  The model is built to be fairly resistant to change though, so despite their hot starts they both have some pretty middling ratings.

The strength of schedule ratings are interesting to me though since they look pretty chaotic.  They are set up simply to take the average ELO rating of each team’s opponents, and then subtract the average overall.  So for example from above, Edmonton’s opponents are 1 ELO point below the average of ALL opponents.  I thought that method seemed pretty simple and good enough, but at the beginning of the season Winnipeg had a schedule against teams that were 8.8 points below average.  Now, over the course of the season, they have a schedule against teams that are 4.1 points above average.  So did all 82 of their opponents for this season really get that much better?  I find it really hard to believe that is true, since only Edmonton, Montreal and Minnesota actually changed by more than that amount.  So I’ll include the strength of schedule numbers this week since I included them last time, but take them with a huge grain of salt.  I’ll try to figure out what is going on with them and update accordingly.

And now that things are starting to sort of quiet down, I should be able to maintain a more consistent update schedule.

10/30/16 ELO Update and Rankings

Projected ELO Ratings

While I know I haven’t been updating nearly as much as I wanted to over the off season, I wanted to at least get up the projected ratings before the regular season starts this week.  Anyway, for the most part the ratings and simulations work the same way as last season, but I’ve added some material so that it can project the winner of the Stanley Cup playoffs as well as the rest of the regular season.

So here are the results of 10000 simulations of the upcoming season:

Rank Team Projected ELO Average Points Stanley Cup Strength of Schedule President Cup Division Winner Playoffs
1 PIT 1568 105 12% 0.0 17% 38% 90%
2 WAS 1562 104 10% 0.3 13% 31% 87%
3 ANA 1548 102 9% -0.9 10% 39% 90%
4 SJ 1543 101 7% 0.7 8% 32% 88%
5 CHI 1542 100 7% -1.1 7% 26% 83%
6 TB 1541 100 7% -0.5 7% 37% 80%
7 STL 1540 99 7% -0.5 6% 24% 82%
8 DAL 1534 98 5% -3.1 5% 21% 79%
9 NYR 1531 98 4% 1.0 4% 13% 73%
10 LA 1522 98 6% 0.5 4% 21% 81%
11 NAS 1516 94 3% -3.4 3% 12% 66%
12 BOS 1514 95 3% -1.9 3% 19% 63%
13 FLO 1514 94 3% 3.2 2% 16% 62%
14 MIN 1509 93 3% 2.2 2% 9% 62%
15 NYI 1508 93 2% 3.4 2% 7% 55%
16 PHI 1503 92 2% -2.1 1% 5% 49%
17 DET 1493 90 1% 4.4 1% 9% 46%
18 OTT 1492 91 2% 0.8 1% 10% 48%
19 MON 1483 89 1% 7.2 1% 7% 40%
20 WPG 1480 87 1% -8.8 1% 4% 38%
21 COL 1477 87 1% -0.8 0% 3% 37%
22 CLB 1474 86 1% 2.7 0% 2% 28%
23 CGY 1473 86 1% 2.6 0% 4% 40%
24 NJ 1470 86 1% -2.3 0% 2% 27%
25 CAR 1465 85 1% 3.1 0% 1% 26%
26 VAN 1452 82 0% -4.8 0% 1% 24%
27 BUF 1446 81 0% 9.2 0% 2% 16%
28 ARI 1442 80 0% -2.3 0% 1% 19%
29 TOR 1430 78 0% -6.3 0% 1% 10%
30 EDM 1427 78 0% -2.3 0% 1% 13%

I don’t have a lot to add to these at the moment since the ELO, projected points, and playoff probabilities pretty much mirror each other.  The one notable exception is Los Angeles.  Since ELO is suggesting there are only 3 above average teams in the Pacific Division, with the rest being below average to terrible, Los Angeles has a much better chance of making the playoffs with an otherwise unremarkable rating.

Other than that, it looks like this year may be another rough year for the Canadian teams in the league.  Montreal has the second hardest schedule of any team in the league (7.2 points above average), and so it should not be too surprising if they struggle again this year.  Winnipeg, Toronto and Vancouver are facing the easiest projected schedules, but they are still most likely all going to be out of the playoffs.

Anyway, things are pretty hectic this year, with 4x as many students in my classes, 3x the classes, and taking classes for my Master’s, but I’ll try to update the projections once a week for the season along with some other write ups.

Until then, it’s great to have hockey back!

Projected ELO Ratings

Travel Distance Has No Effects, But Jet Lag Might

With today being the first day of summer, probably time for me to start working through my summer checklist.

First up:

  • Does travel distance affect a team’s performance?

When it comes to individual games, it seems like travel distance should have an impact in some way.  It seems reasonable that a team like Vancouver would fare a lot worse on the road than a team like the New York Islanders because they have to consistently travel a lot further.  If both the Canucks and the Islanders are playing on the road against the New York Rangers (on different days of course), you’d expect that the Canucks would do worse than the Islanders since they had to travel across the continent.  But in reality, there seems to be no relationship at all between distances traveled to get to games and the team’s winning percentage.

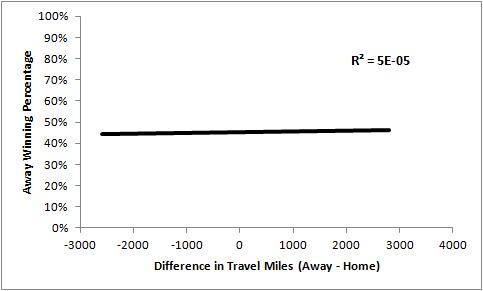
distance

The x-axis shows the difference in the miles traveled for both teams to get to the game from wherever they were before the given game.  Far to the left (over around -3000), and the away team barely moved while the home team traveled cross country to get back to their rink.  Far to the right, and it is the reverse:  the away team traveled long distances while the home team stayed close to home.  The y-axis shows the winning percentage for the away team.  Rather than display all 13000 something points, only the trend line is displayed.  You can see that the away team does slightly better when they have traveled further, but the slope and the correlation coefficient are both essentially 0, meaning that the difference in miles traveled don’t really affect the outcome.

But when the NHL schedules cross country road trips, the team usually gets a little bit of a break, in the form of an extra day or two between games.

Maybe the extra bit of rest counteracts the miles traveled?

It also doesn’t seem like that is the case.

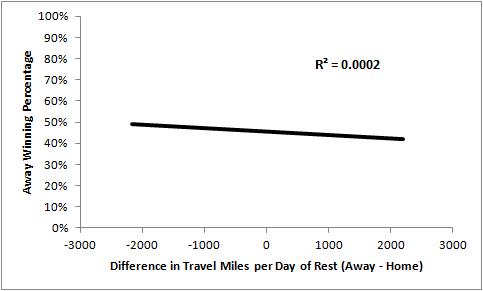
distanceperday

This is almost the same graph as before, just dividing the distances traveled by the number of days between games.  The slope is much more noticeable on this graph: all the way to the left (when the home team has traveled a lot further per day to get to the game), the away team wins about 50% of the time.  All the way to the right (when the away team has to do more traveling per day), then they only win about 44% of the time.  But while that might be what the trend line suggests, the correlation is just about not existent (r = -0.014, p=0.0618).  And based on linear regressions, adding the travel distances does nothing to help the model make better predictions.

But putting on miles is not the only hard part about traveling.  Crossing a lot of time zones, and suffering from jet lag, may hinder a team from playing as best they can.  So, how do teams do when they’ve had to cross time zones?

They perform pretty much as well as the model already expected.

timezones

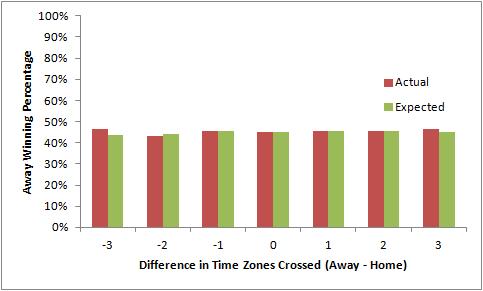
Here is a similar chart to the ones above, but changing from distances into time zones.  The bars to the left show the result of games where the away team stayed in the same time zone, while the home team traveled cross country to return to their own rink.  The bars to the right show the result of games where the home team stayed in the same time zone, while the away team traveled cross country.  Furthermore, the red bars show the actual winning percentages for teams, while the green shows the expected winning percentage based on the ELO model used for this site.

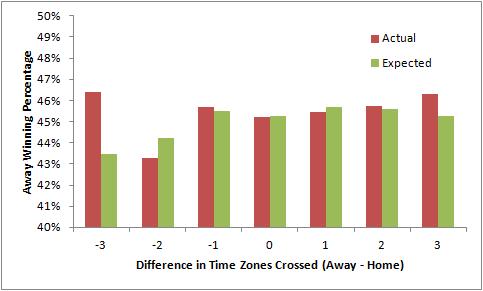
Since the differences are so slight between the red and green, here’s a zoomed in version of the same graph:

timezoneszoomed

You can see that the red bars basically match the green ones, except for the bars at -3 (where the home team had to travel cross country, while the away team stayed in the same time zone).  The model only expected the away team to win 43.5% of those games, but in actuality they won 46.4% of those games.  The difference between the observed and expected winning percentages would translate to about a 21 point ELO bonus to the away team, but this could be a result of small sample size (only 181 games, while each other category has well over 300 apiece).  Adding this bonus results in the model getting 5 additional games correct out of those 181.  Not a huge improvement by any stretch, but it definitely suggests that jet lag may have a bigger impact on the teams returning home.

I’ll look into this idea further, but for now I think that this does not really provide any reason for further tweaking the model at this junction.  There does not seem to be any relationship between distances traveled and winning, and the only effect between crossing time zones and winning seems to be during a very small subset of games.

I’ll try to expand my data set to see if that helps at all, but for now the model will keep on being the same as it has been.

Travel Distance Has No Effects, But Jet Lag Might

Final ELO Ratings for 2015-2016 Season

With Pittsburgh closing out San Jose last night, its time to wrap up the ELO ratings for the season.  Overall, I think that the model did its job reasonably well in the playoffs.  It struggles a bit more with individual games, picking only 52% of games correctly (compared to 58% historically), but it does a fairly good job at predicting winners in a series.  It went 9-6 picking out the winners this year, compared with 10-5 last year.  I imagine a fair amount of that is because the teams are a lot closer in skill level in the playoffs, which makes results more likely to be due to luck (more to come on that during the summer).

Anyway, Pittsburgh was pretty clearly the better team over the second half of the regular season, and also clearly the better team in the Stanley Cup playoffs.

Here is the final table for the ELO ratings, comparing how the teams ended up with where they were projected at the beginning of the season:

Rank Team ELO Rating ELO Change Rank Change
1 PIT 1585 75 14
2 WAS 1577 46 6
3 ANA 1560 16 1
4 SJ 1554 42 8
5 CHI 1553 -5 -3
6 TB 1551 3 -3
7 STL 1550 10 -2
8 DAL 1542 32 7
9 NYR 1539 -28 -8
10 LA 1528 -5 -3
11 NAS 1521 10 2
12 BOS 1517 -18 -6
13 FLO 1517 49 12
14 MIN 1511 -17 -4
15 NYI 1510 9 3
16 PHI 1503 10 7
17 DET 1492 -19 -4
18 OTT 1490 -23 -7
19 MON 1479 -52 -11
20 WPG 1476 -26 -3
21 COL 1471 -30 -3
22 CLB 1468 -27 0
23 CGY 1466 -33 -2
24 NJ 1463 -9 0
25 CAR 1457 1 1
26 VAN 1440 -60 -6
27 BUF 1433 53 3
28 ARI 1427 20 1
29 TOR 1412 -18 -2
30 EDM 1408 -6 -2

You can see a lot of the narratives for the full season in the table above.  Pittsburgh was clearly the most improved team over the projections, which is why they won the Stanley Cup fairly readily.  Florida, Washington and San Jose all greatly improved this year, and should be expected to make a splash next year also.

Buffalo clearly has the best prospects of any of the lower 10 teams.  They made a marked improvement over last year’s form (admittedly not a hard thing to do), and while they probably won’t make the playoffs next year, they seem to be headed in the right direction.

On the flip side, you can see every single Canadian team failing to live up to their expectations (even the low expectations for Toronto and Edmonton!) and finishing as a below average team.

Anyway, over the summer I’ll be continuously adjusting, calibrating and testing some of the model’s parameters.  To begin with, here is a subset of questions that I’ll be trying to address during the off season:

  • How much does luck affect individual hockey games?
  • Does travel distance affect a team’s performance?
  • Will the ELO model perform better with advanced stat inputs?
  • Do individual players affect their team’s ELO ratings?
  • Which statistics are best able to predict the regular season success of a team?

And probably some other ones that I don’t remember at the moment.  I’ll be sure to write up anything I do/don’t find, but let me know if there is anything else that I should try and look into.

Final ELO Ratings for 2015-2016 Season

6/10/16 Stanley Cup Playoff Probabilities

Working on a lot of different things at the moment, so I’ll just update the tables here:

ELO Win in 4 Win in 5 Win in 6 Win in 7 Total win %
PIT 1581 0.0% 0.0% 48.0% 30.1% 78.1%
SJ 1558 0.0% 0.0% 0.0% 21.9% 21.9%

Pittsburgh remains pretty heavily favored, even though the model suggests that Game 7 is more likely to happen than not.

6/10/16 Stanley Cup Playoff Probabilities

6/7/16 Stanley Cup Playoff Probabilities

It should probably go without saying that San Jose has a really tough task to get back and win this series.  San Jose came into this series as an underdog, needing to steal at least one away win, but at least it looked like it could be a competitive series.  While Pittsburgh was favored, the model said that the most likely series length was a 7 game series.  After San Jose’s loss last night, the model gives Pittsburgh an almost 60% chance of ending the series on Thursday night in Game 5.  So what happened to San Jose?  They haven’t been getting shots through the Pittsburgh defense.

As a reminder, when I looked at the various fancy stats, the only one that helped the ELO model predict series outcomes was the ability to get unblocked shot attempts through the defense during close games(in other words, the team with the higher Fenwick rating during close game situations was more likely to win a series controlling for the differences in ELO).

Up until the Stanley Cup Finals, both San Jose and Pittsburgh were doing really well with getting unblocked shot attempts.  San Jose had an average Fenwick rating of 56.2% while Pittsburgh had an average Fenwick of 54.4%.

In the Stanley Cup Finals, the Penguins have been getting a lot more shots on goal (133 out of 231, or 57.6%), but Pittsburgh’s advantage slims down a lot when looking at just the shot attempts (a.k.a. Corsi rating), where they have 52.9% of total shot attempts.  The difference is because the Penguins are doing a better job of getting shots blocked (93 blocks to San Jose’s 74 blocks).

All of this leads to Pittsburgh dominating the Fenwick ratings in close game situations in this series (54.5% to 45.5%), which is why San Jose is on the brink of elimination.

Anyway, here is the updated table:

ELO Win in 4 Win in 5 Win in 6 Win in 7 Total win %
PIT 1586 0.0% 59.2% 20.1% 12.2% 91.6%
SJ 1553 0.0% 0.0% 0.0% 8.4% 8.4%
6/7/16 Stanley Cup Playoff Probabilities